Equality Act 2010:
Public Sector Equality Duty (PSED) annual review 2023
Publication of information
Prepared by: Amanda Ambler
Role: Interim head of EDI
Date: March 2023
Contents
1. Introduction
- 1.2 The public sector equality duty (PSED)
- 1.3 Equality delivery system (EDS2022)
- 1.4 Gender pay gap report
2. Our people and our communities
3. EDI activity 2022 to 2023
4. Equality diversity and inclusion objectives and priorities
1 Introduction
Rotherham, Doncaster and South Humber NHS Trust is a diverse employer and provider of services across Rotherham, Doncaster and Scunthorpe. Our aim is to create a culture of inclusion where everyone feels valued and respected for who they are and what they bring to our organisation. Our equality, diversity and inclusion activity is linked to the NHS people plan, the trust’s people plan and strategic objectives.
Our public sector equality duty (PSED) report highlights the progress we have made in the year of 2022. The last year and indeed 2021, has been one of the most challenging times to operate, but it has further raised the importance of equality, inclusion and diversity at a time when a global pandemic has brought underlying issues to the forefront.
The services we provided during 2022/2023 in the different localities:
Rotherham
- adult mental health
- children’s services
- learning disabilities
- older people’s mental health
Doncaster
- adult mental health
- children’s services
- community integrated services
- learning disabilities
- forensic services
- older people’s mental health
- drug and alcohol services
North Lincolnshire
- adult mental health
- children’s services
- community learning disabilities
- older people’s mental health
RDaSH’s refreshed strategy 2021 to 2023
The strategic plan focuses on our patients, carers, public and colleagues and is a mix of strategic and operational planning to cover the next two years and shows what we are aiming to deliver during that time. We will be focusing heavily on improving safety and quality, you (our people), improving access to our services for patients and improving leadership from ‘ward to board: board to ward’.
Our plan sets out:
- WHY we are here: we want to lead the way with our care.
- WHAT we want to do: our four strategic ambitions.
- HOW we are going to do it: our seven strategic objectives.
These are shown below in our easy-to-understand image.
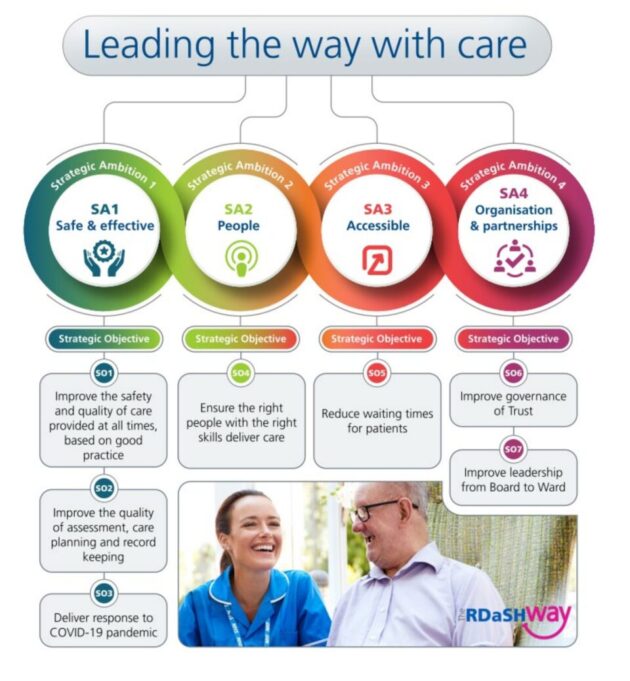
What this image shows is that we have 4 strategic ambitions made up of 7 strategic objectives:
Strategic ambition 1, safe and effective
- Strategic objective 1, improve the safety and quality of care provided at all times, based on good practice.
- Strategic objective 2, improve the quality of assessment, care planning and record keeping.
- Strategic objective 3, deliver response to COVID-19 pandemic.
Strategic ambition 2, people
- Strategic objective 4, ensure the right people with the right skills deliver care.
Strategic ambition 3, accessible
- Strategic objective 5, reduce waiting times for patients.
Strategic ambition 4, organisation and partnerships
- Strategic objective 6, improve governance of the trust.
- Strategic objective 7, improve leadership from board to ward.
Our people and organisational development strategy has been developed to support our RDaSH refreshed strategy 2021-2023. It is aligned with the integrated care system’s workforce strategies, NHS people plan and the NHS 10 year plan.
The two-year plan is focused on our people being empowered, skilled, engaged and responsive and has such principles as equality, diversity and inclusion at its heart. The focus ensures colleague and patient experience are constantly monitored to foster a positive culture which is responsive and supportive should problems be detected and ensure good is shared all in line with our values.
The general equality duty
The equality act 2010 introduced a general equality duty requiring organisations to have due regard in the exercising of their functions. The duties are outlined in section 149 of the act as follows:
- eliminate unlawful discrimination, harassment, victimisation and other conduct prohibited by the act
- advance equality of opportunity between people who share a protected characteristic and those who do not; and
- foster good relations between people who share a protected characteristic and those who do not.
This will be achieved by:
- removing or minimising disadvantages suffered by people due to their protected characteristics
- taking steps to meet the needs of people from protected groups where these are different from the needs of other people
- encouraging people from protected groups to participate in public life or in other activities where their participation is disproportionately low
- the steps involved in meeting the needs of disabled persons that are different from the needs of persons who are not disabled include steps to take account of disabled persons’ disabilities
- having due regard to the need to foster good relations between persons who share a relevant protected characteristic and persons who do not share it involves having due regard to the need to tackle prejudice and promote understanding
The protected characteristics covered by the equality act are:
- age
- disability
- gender
- gender reassignment
- race
- religion or belief
- sexual orientation
- marriage or civil partnership
- pregnancy and maternity
1.2 The public sector equality duty (PSED)
The public sector equality duty (PSED), which came into force on 6 April 2011, places additional specific duties on public authorities including NHS trusts. Two such duties are a requirement on public authorities to:
- publish sufficient information to demonstrate compliance with the general equality duty by 31 January 2012 and thereafter annually
- prepare and publish 1 or more equality objectives by 6 April 2012 and no more than four years thereafter.
The published information is to include:
- information on the effect that policies and practices have had on employees, service users and others from the protected groups
- evidence of the analysis undertaken to establish whether their policies and practices will (or have) furthered the three equality aims in the general equality duty
- details of information used in that analysis
- details of engagement with people with an interest in the aims of the duty
1.3 Equality delivery system (EDS2) (formerly EDS2)
The Equality Delivery System (EDS) is a system that helps NHS organisations improve the services they provide for their local communities and provide better working environments, free of discrimination, for those who work in the NHS, while meeting the requirements of the Equality Act 2010. The EDS was developed by the NHS, for the NHS, taking inspiration from existing work and good practice.
A review of the EDS2 was undertaken to incorporate system changes and take account of the new system architecture. Through collaboration and co-production and considering the impact of COVID-19, the EDS has been updated and EDS 2022 is now available for live
testing during 2022/23.
EDS 2022 is a generic system designed for both NHS commissioners and NHS providers. As different systems apply EDS 2022 outcomes to their performance, NHS organisations should do so with regard to their specific roles and responsibilities.
EDS 2022 implementation by NHS provider organisations is mandatory in the NHS standard contract. EDS 2022 implementation will continue to be a key requirement for all NHS commissioners.
RDaSH have completed the initial pilot for 2022/2023 for two services this can be found in appendix 1.
1.4 Gender pay gap report
In accordance with the equality act 2010 (gender pay gap information) regulations 2017, employers with 250 or more employees are required to publish information on the pay gap between male and female employees as of 31 March each year. This information must be published on the employer’s website.
The gender pay gap report is based on a snapshot date of pay of 31 March 2022. Our data can be compared to other organisations by using the government gender pay gap reporting portal (opens in a new window).
The analysis of the trust’s gender pay gap data informs our gender pay gap action plan which has been created to address the disparities. Our data shows an improvement compared to previous years but indicates areas where improvements are required.
The gender pay gap is different to equal pay. Equal pay relates to men and women receiving equal pay for equal work. The gender pay gap is a measure of any disparity in pay between the average earnings of male and female employees.
2. Our people and our communities
The people of RDaSH and the people who access our services are diverse and we are striving to understand the diversity of our people and the best and most appropriate way to meet their needs. As an organisation we are continually working towards creating a knowledge base which supports our people and communities.
In this section we provide internal information regarding our people, this data is accurate as at September 2022. This information supports further analysis and the implementation of interventions to ensure that equity is given to all our people, they represent the communities
we serve and diversity is supported throughout the organisation.
Census details are taken from the 2021 National Census.
| Ethnic origin | Doncaster | Rotherham | North Lincolnshire |
|---|---|---|---|
| White | 93.1% | 91.0% | 94.3% |
| Mixed | 1.5% | 1.4% | 1.1% |
| Asian | 2.9% | 5.3% | 3.3% |
| Black | 1.2% | 1.1% | 0.5% |
| Other | 1.2% | 1.1% | 0.8% |
The population of the localities we serve has a high representation of people who have defined their ethnic origin as white, our workforce demographics is reflective of this. Comparing population demographics with internal demographics shows that the trust is under-represented from people with ‘mixed’ and ‘Asian’ ethnic origins but over-represented from people who have a ‘black’ ethnic origin. The trust’s workforce race equality action plan addresses areas to improve these statistics.
The trust provides services in Rotherham, Doncaster and North Lincolnshire. Therefore, the Office for National Statistics data used for benchmarking in this report will be the average population data for those areas as detailed in the 2021 census information and is demonstrated in the table above.
Age
The age of the population served by the trust
The 2021 census indicated that there are slightly more women than men. In age groups 50 to 64 there are slightly more men than women but in older age groups there are more women than men because life expectancy for women is slightly better than for men.
Age ranges changed in the 2021 census:
| Age range | Doncaster | Rotherham | North Lincolnshire |
|---|---|---|---|
| 16 to 19 | 4.1% | 4.3% | 4.1% |
| 20 to 24 | 5.3% | 5.3% | 4.8% |
| 25 to 34 | 13.6% | 13.0% | 12.0% |
| 35 to 49 | 18.4% | 18.4% | 17.6% |
| 50 to 64 | 20.6% | 20.5% | 21.8% |
| 65 to 74 | 10.7% | 10.6% | 11.9% |
| 75 to 84 | 6.3% | 6.7% | 7.3% |
| 85+ | 2.4% | 2.3% | 2.8% |
Age of people who work in RDaSH
The number of younger people working in our services has remained the same for 16 – 20 age range however, there was an increase in the 21 -25 age group. The number of staff over 60 and 66+ has increased since 2021. The percentage of staff in the 46 – 50 has significantly decreased and the 51 – 55 age group has also slightly increased. Other age groups remain relatively static.
| Age range | 2021 total |
2021 total % |
2022 total |
2022 total % |
|---|---|---|---|---|
| 16 to 20 | 7 | 0.19% | 7 | 0.2% |
| 21 to 25 | 182 | 5.11% | 208 | 5.6% |
| 26 to 30 | 363 | 10.2% | 394 | 10.6% |
| 31 to 35 | 369 | 10.37% | 410 | 11.0% |
| 36 to 40 | 425 | 11.95% | 448 | 12.0% |
| 41 to 45 | 376 | 10.57% | 422 | 11.4% |
| 46 to 50 | 462 | 12.99% | 32 | 11.6% |
| 51 to 55 | 501 | 14.08% | 510 | 13.7% |
| 56 to 60 | 503 | 14.14% | 500 | 13.4% |
| 61 to 65 | 303 | 8.52% | 328 | 8.8% |
| 66+ | 51 | 1.43% | 62 | 1.7% |
| 71 and above | 14 | 0.39% | N/A | N/A |
| Total | 3,556 | 100% | 3,721 | 100% |
Disability
| Disability | Doncaster | Rotherham | North Lincolnshire |
|---|---|---|---|
| Disabled in some capacity | 20.4% | 21.3% | 19.0% |
Disability and people who work in our trust
In March 2020 the first national workforce disability equality standard (WDES) report was published. This allowed us for the first time to compare areas of workforce disability to a national picture. Our organisation published its fourth WDES report in August 2022 and this
is published separately.
Although our declaration rates are relatively good, they have remained static despite a specific focus on this area in 2021/2022 including producing guidance for staff about how to change their record using the electronic staff record (ESR) self-service. The WDES
average of declared disability in the national report is broken down by clinical and non-clinical and indicates that 3.6% of non-clinical and 2.9% of clinical staff declared disability with a range across organisations.
Our organisation figure of 6.2% (for all staff) in 2022 which is relatively positive. The number of staff who have declared they have a disability has increased since 2021 (+0.8%).
| Disability | 2021 total |
2021 total % |
2022 total |
2022 total % |
|---|---|---|---|---|
| Yes | 193 | 5.4% | 229 | 6.2% |
| No | 2,561 | 72.0% | 2,691 | 72.3% |
| Not declared | 802 | 22.6% | 792 | 21.2% |
| Prefer not to answer | 0 | 0% | 9 | 0.2% |
| Total | 3,556 | 100% | 3,721 | 100% |
In 2022 the trust received 866 applications (7.2%) from applicants with a disability, of which 439 (5.8%) were shortlisted of the 439 shortlisted, 33 (10.1%) were offered positions and started with the trust.
In 2021 the trust received 492 applications (6.9%) from applicants with a disability, of which 237 (48.2 %) were shortlisted of the 237 shortlisted, 21 (4.2%) were offered positions and started with the trust.
Protected characteristic of sex
Sex and gender are different and only some of the data we are able to collect will have been collected based on gender, where there may not be an option other than male or female.
The 2021 census indicated that overall, there were slightly more women in the communities we serve than men.
| Gender | Doncaster | Rotherham | North Lincolnshire |
|---|---|---|---|
| Male | 49.6% | 49.0% | 49.3% |
| Female | 50.4% | 51.0% | 50.7% |
The gender of people in our trust
The breakdown of employees by gender remains at a rounded figure of 84% women and 16% men. There is no option in the national electronic staff record to record ‘other’ at the moment however we understand that a change to this is being planned, as soon as this is
available, we will provide information to our staff so they can change their details if they wish.
| Gender | 2021 total |
2021 total % |
2022 total |
2022 total % |
|---|---|---|---|---|
| Female | 2,980 | 83.8% | 3,131 | 84.1% |
| Male | 576 | 16.2% | 590 | 15.9% |
| Total | 3,556 | 100% | 3,721 | 100% |
Each year we produce and publish a full report and action plan on the gender pay gap and our last report that contained data for 2022 was published in March 2023. Our data can be compared to other organisations by using the government gender pay gap reporting portal (opens in a new window) and our gender pay gap report can be found on our website.
Sexual orientation
Sexual orientation of the population
Census 2021 was the first census to provide estimates of gender identity, and so while there are no previous directly comparable estimates available, the estimates are considered broadly in line with other data on gender identity.
The Office of National Statistic (ONS) published updated data on sexual orientation (opens in a new window) in May 2022. This reported that the proportion of the UK population aged 16 years and over identifying as heterosexual or straight was 93.6% in 2020; there has been a decreasing trend since the series began in 2014.
An estimated 3.1% of the UK population aged 16 years and over identified as lesbian, gay or bisexual (LGB) in 2020, an increase from 2.7% in 2019 and almost double the percentage from 2014 (1.6%).
The proportion of men in the UK identifying as LGB increased from 1.9% to 3.4% between 2014 and 2020; the proportion of women identifying as LGB has risen from 1.4% to 2.8% over the same period.
People aged 16 to 24 years continue to be the most likely to identify as LGB in 2020 (8.0%) reflecting an increasing trend for this age group since 2014; this breaks down to 2.7% identifying as gay or lesbian, and 5.3% identifying as bisexual.
In 2020, women (1.6%) were more likely than men (0.9%) to identify as bisexual but were less likely to identify as gay or lesbian (1.1% compared with 2.5%); these differences between men and women are more pronounced in the younger age groups.
Among those identifying as LGB in 2020, almost three-quarters (72.5%) had never been married or in a civil partnership, while just under one-quarter were married or in a civil partnership (23.7%); this may reflect the younger age structure of the LGB population and
that the legislation for same-sex civil partnerships and same-sex marriage is relatively recent.
Sexual orientation of people who work in our trust
The profile of the trust in relation to sexual orientation has remained relatively unchanged since 2021, apart from the increase of 2.8% increase in heterosexual or straight and a positive shift of 3.2% in ‘Undisclosed’ which was a new category introduced in 2020.
| Sexual orientation | 2021
total |
2021
total % |
2022
total |
2022
total % |
|---|---|---|---|---|
| Gay or lesbian | 46 | 1.3% | 51 | 1.4% |
| Heterosexual or straight | 2,545 | 71.6% | 2,767 | 74.4% |
| Bi-sexual | 18 | 0.5% | 29 | 0.8% |
| Other | 4 | 0.1% | 5 | 0.1% |
| Undecided | 3 | 0.1% | 6 | 0.1% |
| Undisclosed | 940 | 26.4% | 863 | 23.2% |
| Total | 3,556 | 100% | 3,721 | 100% |
23.2% of people employed within RDaSH have not shared their sexual orientation status and although work was undertaken and the figure has improved, we still have further work to do around equality monitoring to address this issue and encourage and support colleagues to feel comfortable and confident in doing this.
In 2022 the Trust received 593 (5%) of job applications from applicants who were not ‘heterosexual’ or ‘undisclosed’ compared to 552 (7.3%) applications in 2021. Of the 593 applicants, 348 (4.6%) were shortlisted compared to 177 (6.6%) in 2021. Of the 348 shortlisted, 14 (4.2%) of people started with the trust which is a decrease of 0.7% from 2021.
Within the employee relations section (disciplinary, grievance and harassment), there are no issues highlighted in relation to gender.
Race
Ethnicity of the people who work in our trust
The table below shows the percentages of staff by ethnicity who are employed by the trust. Arab and Gypsy or Irish Traveller are not available in the NHS electronic staff record (ESR) which is why there is no figure for these two groups. More detail can be found in the
workforce race equality standard report published in August 2022.
100% of trust staff have their ethnicity recorded on ESR. The 51 staff under the ‘Not Known’ category are staff who do not wish to declare their ethnic origin. The trust continues to encourage staff to update their data on ESR and this has resulted in a decrease of ‘Not Known’ from September 2021.
New starter information, including ethnicity, is now automatically downloaded from successful applicants’ application forms from NHS jobs to ESR which significantly improves the data capture of equality and diversity information.
| Category | Male | Female | Total | Total % |
|---|---|---|---|---|
| WHITE | 522 | 2,926 | 3,448 | 92.66% |
| White – British | 505 | 2,860 | 3,365 | 90.43% |
| White – Irish | 4 | 8 | 12 | 0.32% |
| White – Any other White Background | 13 | 58 | 71 | 1.91% |
| MIXED | 7 | 30 | 37 | 1.00% |
| Mixed – White & Black Caribbean | 1 | 11 | 12 | 0.32% |
| Mixed – White & Black African | 1 | 3 | 4 | 0.11% |
| Mixed – White & Asian | 3 | 4 | 7 | 0.19% |
| Mixed – Any other mixed background | 2 | 12 | 14 | 0.38% |
| ASIAN | 24 | 55 | 79 | 2.12% |
| Asian or Asian British – Indian | 14 | 27 | 41 | 1.10% |
| Asian or Asian British – Pakistani | 5 | 12 | 1 | 0.46% |
| Asian or Asian British – Bangladeshi | 0 | 3 | 3 | 0.08% |
| Asian or Asian British – Any other Asian background | 5 | 11 | 16 | 0.43% |
| Chinese | 0 | 2 | 2 | 0.05% |
| BLACK | 22 | 81 | 103 | 2.77% |
| Black or Black British – Caribbean | 4 | 14 | 18 | 0.48% |
| Black or Black British – African | 15 | 63 | 78 | 2.10% |
| Black or Black British – Any other Black background | 3 | 4 | 7 | 0.19% |
| OTHER | 0 | 3 | 3 | 0.08% |
| Any other ethnic group | 0 | 3 | 3 | 0.08% |
| NOT KNOWN | 15 | 36 | 51 | 1.37% |
| Not stated | 15 | 36 | 51 | 1.37% |
| TOTAL | 590 | 3,131 | 3,721 | 100% |
The trust provides services in Rotherham, Doncaster and North Lincolnshire. Therefore, the Office for National Statistics data used for benchmarking in this report will be the average population data for those areas as detailed in the 2021 census information.
This is as follows:
| Category | Doncaster | Rotherham | North Lincolnshire |
|---|---|---|---|
| White | 93.1% | 91.0% | 94.3% |
| Mixed | 1.5% | 1.4% | 1.1% |
| Asian | 2.9% | 5.3% | 3.3% |
| Black | 1.2% | 1.1% | 0.5% |
| Other | 1.2% | 1.1% | 0.8% |
Religion or belief
Religion or belief is a protected characteristic and this includes people who have no belief.
XXXXXXXXXXXXXXXXXXXXXXXXXXXXXXXXXXXXXXXXXXXXXXXXXXXXXXXXXXXXXXXXXXXXXXXXXXXXXXX
XXXXXXXXXXXXXXXXXXXXXXXXXXXXXXXXXXXXXXXXXXXXXXXXXXXXXXXXXXXXXXXXXXX
Appendix 1
Appendix 2
Page last reviewed: February 20, 2024
Next review due: February 20, 2025